
Data Analytics and Website Traffic Measurement

You are already collecting data. The question is whether anyone can actually use it. We pull scattered sources into one place, chart what matters and put live answers on a single screen, so answering “how are we doing?” stops needing an analyst and a free afternoon. Website traffic belongs here too: who came, where from, and what they did on the page.

From€800per project

  • €0a month in licences, the code is yours
  • 100%of transfers written to a log
  • 1 processto start with, the one that hurts most
  • 1 dry runbefore the manual transfer is switched off

Data analytics brings numbers from your website, shop, ads and accounting into one place so you can make decisions from them. Data visualisation costs from €800, connecting sources from €1,200, a dashboard from €1,650. We start with the questions you want answered and only then draw the charts.

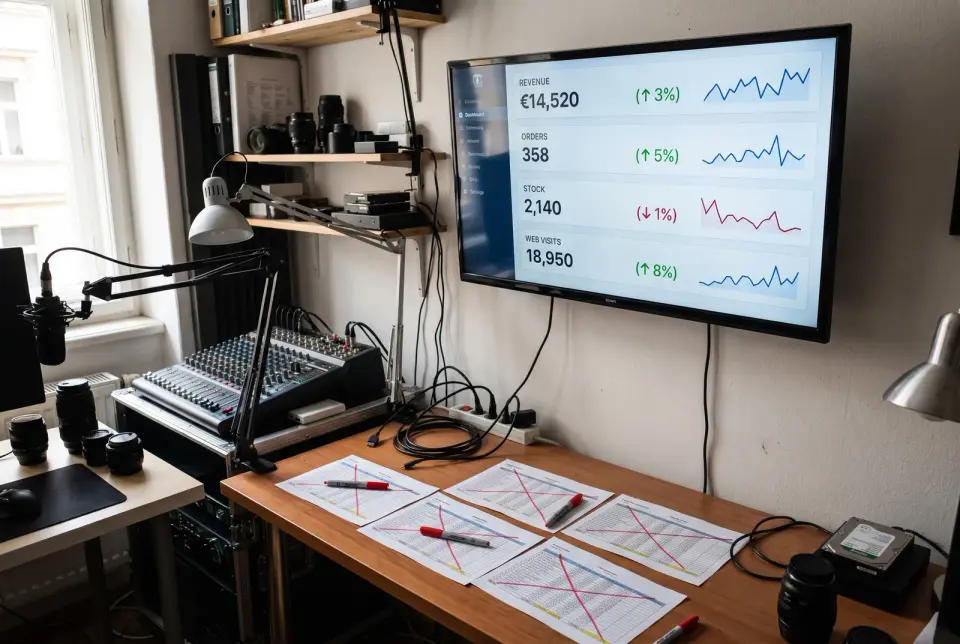
One dashboard instead of five spreadsheets, with data that updates itself.

One dashboard instead of five spreadsheets, with data that updates itself.

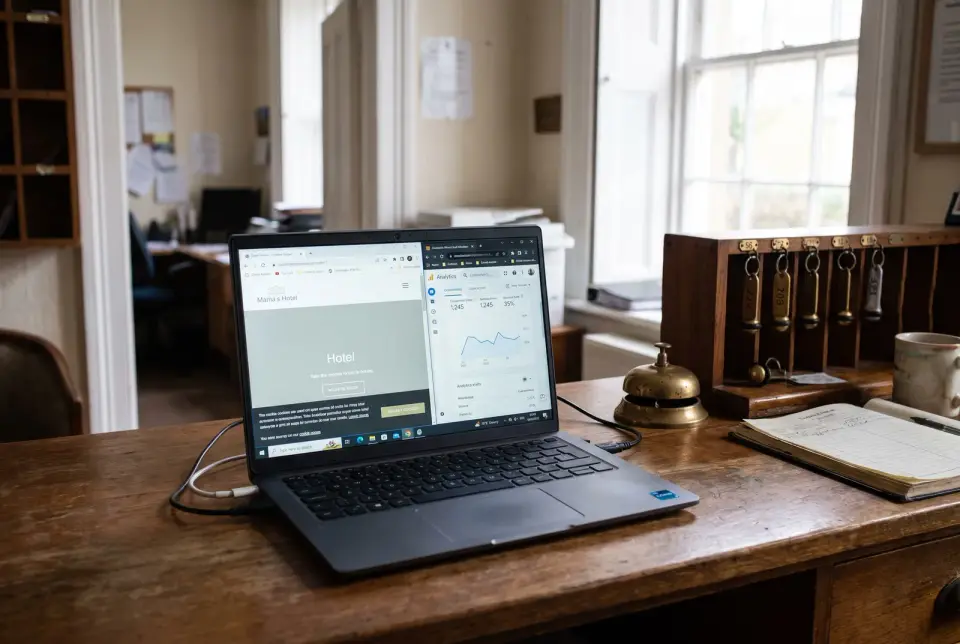
We measure website traffic in line with your cookie banner, so the numbers match what you're allowed to collect.

We measure website traffic in line with your cookie banner, so the numbers match what you're allowed to collect.

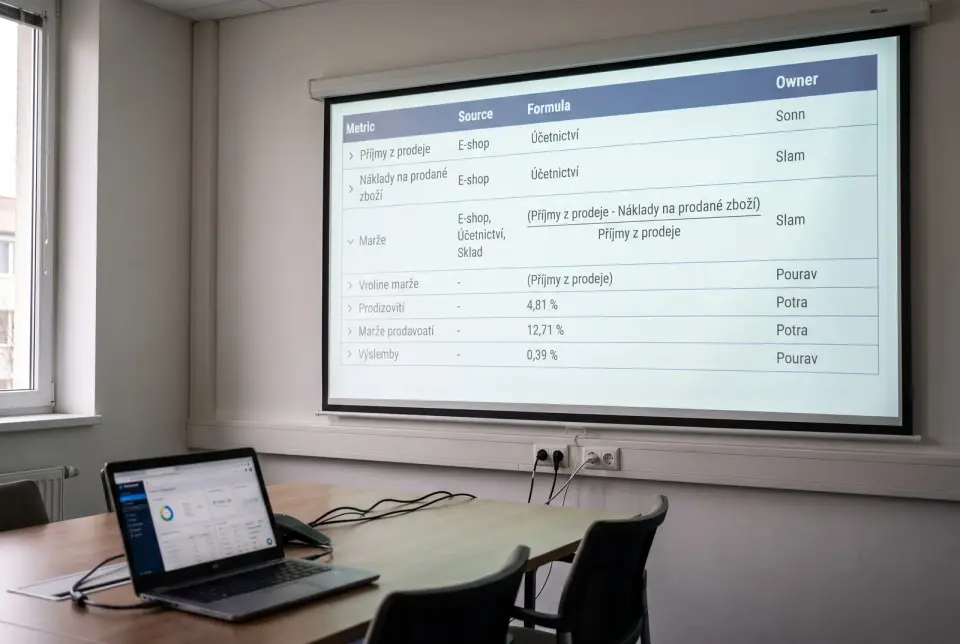
Every number has a documented source and formula, so nobody argues about it in meetings.

Every number has a documented source and formula, so nobody argues about it in meetings.

We track search rankings too, and you see them next to traffic and revenue.

We track search rankings too, and you see them next to traffic and revenue.

Every service in this category, explained

  • Data Integration

    Data from all your systems, cleaned, in one place.

    In short ETL pipelines that pull your systems into one warehouse: cleaned, deduplicated and refreshed on a schedule. The unglamorous plumbing every real analytics setup runs on.

    How we workWe set up scheduled pulls, match formats, match the same customer across sources and remove duplicates. Where there’s no shared identifier, we say upfront that the matching stays an estimate, and agree together whether that’s good enough for the decision at hand. It’s built in separate steps, so adding a new source later just means adding one step on top.

    What you getOne place holding data from every system, cleaned and refreshed on schedule, that your reports and dashboards can run on. You also get a map of where each field comes from and how it’s matched, written down instead of living in one person’s head.

    What's included

    • Scheduled pulls from every system
    • Matches customers, removes duplicates
    • New sources plug in easily
    • Manual exports finally stop

    Data Visualization

    Charts that answer a question.

    In short Charts that answer a real question: the right chart type for the data, honest scales, readable by someone with thirty seconds and zero context.

    How we workWe pick the chart type based on what’s actually being compared. Axes stay honest, and every number gets a label saying what it measures and over what period. We check readability in print, in black and white, and for color blindness too.

    What you getCharts that answer a specific question, with labels, units and the time period sitting right next to the number. You get them in a format you can drop straight into a slide deck or a report, plus a style guide for building more that match the same look.

    What's included

    • Chart type matches what you compare
    • Honest axes, clearly labeled
    • Clear within thirty seconds
    • Still readable in black and white

    Dashboard development

    A live overview for sales, marketing or operations.

    In short A live dashboard for sales, marketing or operations that shows where you stand right now. We build it over your own data in Grafana, Metabase or a custom tool. Website traffic by source and device belongs in it, and so does page speed.

    How we workWe pick the tool based on what you already run and what you’re willing to pay in licenses, whether that’s Grafana, Metabase or something custom. We set how often data refreshes, what happens if a source goes down and who gets to see what. Then we add drill-downs and alerts on the thresholds you set.

    What you getA live view for sales, marketing or operations that opens on your phone or projects onto the office screen. You also get permissions set up properly, alerts on the thresholds you choose, and a description of exactly how each number gets calculated.

    What's included

    • Built on the tools you already run
    • Refresh rate, permissions handled
    • Drill-downs plus alerts
    • On your phone or the office screen

    Business intelligence

    From numbers to a decision on what to do next.

    In short From “what happened” to “what do we do about it”: cohorts, margins, funnels and forecasts, analyzed and turned into an actual decision you can act on.

    How we workFirst we agree the definitions of each number in writing. Then we work out cohorts, margins by product and channel, customer payback time and where you’re losing the most money. The result gets turned into a recommendation you can actually act on.

    What you getAn analysis with recommendations, in a form you can bring straight to a meeting and decide from, plus written definitions of every number used. It also spells out what the data can’t tell you, so an estimate never gets treated as the certainty a whole budget gets built on.

    What's included

    • Margins, cohorts, customer payback time
    • Every number defined in writing
    • A decision backed by numbers
    • Limits stated plainly

    Sound familiar?

    John Doefirst call
    1. We don't know how many people visit the site or where from

    2. Google Analytics is installed, but nobody trusts it or knows how to read it. We set up measurement properly and translate it into a few numbers that make sense.

    3. Every report shows a different number

    4. Ads report different revenue from the shop, and the shop different from accounting. We define what each number means, and the dashboard calculates everything from one source.

    5. The monthly report takes two days to put together

    6. Downloading from five systems, pasting into a spreadsheet, fixing formulas. A dashboard updates itself and the report is ready on Monday morning.

    7. We have data but don't make decisions with it

    8. Hundreds of metrics help nobody. We start with the questions management asks and show one number and its trend for each.

    Which one sounds like you?

    Pick your case and enter your own numbers. The screen works out what you're losing or gaining.

    I repeat the same task every day

    Minutes a day on the same task30 min
    How many people do this2
    How much your hour is worth€30

    The routine eats up

    22 hours a month

    30 min a day for 2 people over 22 working days is €660 a month at €30 an hour. Automation typically costs €1,200 and pays for itself in 1.8 months.

    22 working days in a month. Upper estimate: we assume automation takes over the task entirely. Typical price from the studio price list.

    My tools won’t talk to each other

    Records a week you move by hand between systems61
    Minutes per record3 min
    How much your hour is worth€30

    Manual data entry costs

    €396 a month

    61 records a week at 3 min each is 13.2 h a month at €30 an hour. An integration typically costs €1,150 and pays for itself in 2.9 months.

    We count a month as 4.33 weeks. We don't count mistakes made during entry, their cost comes on top. Typical price from the studio price list.

    I put reports together by hand

    How many reports a month6
    Hours per one3 h
    How much your hour is worth€30

    Manual reports cost

    €540 a month

    6 reports at 3 h each, that's 18 h a month at €30 an hour. A dashboard that fills itself typically costs €2,050 and pays for itself in 3.8 months.

    Upper estimate: we assume the dashboard replaces manual reports entirely. Typical price from the studio price list.

    Is Google Analytics enough on its own?

    Free Google Analytics measures website traffic, and for plenty of companies that's enough. The difference starts when you want to see the website, ads, sales and costs side by side and trust what you see.

    When GA alone is enough

    • You mainly care about traffic and where visitors come from
    • You have one website and one main revenue source
    • You look at a report once a month
    • Measurement is set up correctly, including cookie consent

    When you need more

    • Revenue is in the shop, costs in accounting and ads across three accounts
    • Numbers in different tools don't match and nobody knows why
    • Management wants a weekly overview and someone builds it by hand
    • You need to see margin and return, beyond traffic

    From scattered numbers to one screen

    1. You know what you want to know

      Call and questions

      We list the questions you're looking to answer: where customers come from, what pays off, where money leaks.

    2. The data is trustworthy

      Measurement audit

      We check Google Analytics, the cookie banner, conversions and the link to ads. We fix whatever measures wrongly. You get a fixed price.

    3. The data is in one place

      Connecting sources

      Website, shop, ad accounts, CRM and accounting flow into one store that updates itself.

    4. The answers are visible

      Dashboard

      One number per question, its trend and a comparison. The formula is described right next to the chart.

    5. The numbers add up

      Verification

      We compare the dashboard with accounting and the source systems. Differences get explained or fixed.

    6. The team uses it

      Handover

      A short training session, metric documentation and, after a month, adjustments based on what people actually look at.

    What data analytics costs

    Data visualisation from €800, data integration from €1,200, business intelligence from €1,450, custom dashboard from €1,650. Tool licences are paid directly, and free ones often do the job. Nothing is added on top, the price is final.

    Check pricing

    AI built to actually do the work

    AI and automation earn their keep when they’re wired into real workflows with real data. Without that, it’s just theater. We build the first kind: we map how the work actually happens, put a price on the wasted hours, and automate the steps where the numbers make the case on their own. Tools run on infrastructure your team can maintain, monitored so failures get flagged immediately, and handed over with full documentation and access. You end up owning the code and the pipeline. There’s no black-box subscription you can’t see inside.

    What you ask most often

    How do I check my website traffic?

    The simplest way is Google Analytics or another measurement tool added to the site. It shows visits, where people came from and what they did. For the numbers to be right, measurement has to be linked to the cookie banner and conversions set up correctly.

    What is Google Analytics?

    Google Analytics is Google's free web analytics tool. It measures traffic, traffic sources, on-site behaviour and conversions, such as a submitted form or a purchase.

    How do I track search rankings?

    Google Search Console gives you the basics for free: average positions, impressions and clicks by query. Paid tools track specific phrases and competitors. We can put both in a dashboard next to traffic and revenue.

    How much does a dashboard cost?

    Visualisation on top of existing data from €800, a custom dashboard from €1,650, typically around €2,050 depending on the number of sources. Tools like Looker Studio are free. Nothing is added on top, the price is final.

    What do you build dashboards in?

    Most often Looker Studio, which is free, and Power BI or Metabase for larger volumes. We choose by how much data you have and who'll work with it.

    How do I increase website traffic?

    Analytics shows which sources work and where people leave. Traffic itself grows through SEO, content and ads. We handle those in our marketing services and measure the results here.

    Why don't the numbers in different tools match?

    Every tool counts differently: ads attribute conversions by their own model, analytics can't see people who declined cookies, and accounting knows about returns. We document the differences, and the dashboard calculates from one source.

    Is the measurement GDPR compliant?

    We only measure what the visitor allowed in the cookie banner and set a data retention period. Where possible we use measurement without personal data.

    How long does a dashboard take to build?

    A measurement audit and fix takes one to two weeks, a dashboard over several sources three to five weeks, including a check against accounting.

    Ready to build something solid?

    Drop us a message. We reply within a few hours to set up a quick chat.

    1. 1Within hours: a human reply: first thoughts, maybe a question or two.
    2. 2Within days: a 30-minute call. You talk, we listen. Free, no obligations.
    3. 3After the call: a written fixed quote, or an honest answer that we're not the right fit, with a tip on who to ask instead.

    No sales scripts. You'll be talking to the people who'll actually build it.

    Allergic to forms? Fair.info@chronicles.cz+420 773 230 278

    By submitting this form, you're agreeing that we can use the details above to answer your enquiry. How we handle your data. We use it only to reply. We never sell it or add you to a mailing list.