Spectrum Interactive
An investing course platform that hands over compound interest as a tool you can pull on, instead of explaining it in a paragraph.
Measured on the live site, exactly as a visitor sees it.
Inter Tight
Headings and bodyAa
- SpectrumMedium 500
- SpectrumSemiBold 600
- SpectrumBold 700
АБВГҐДЕЄЖЗИІЇЙ abcdefghijklm 0123456789
Bruno Ace
LogoAa
- SpectrumRegular 400
ABCDEFGHIJKLM abcdefghijklm 0123456789
Corner radii
- 16 px
- 32 px
- pill
Buttons: pill
Type scale
- AaH1, 96 px
- AaH2, 48 px
- AaH3, 24 px
- AaBody, 20 px
Contrast
- 15.7 : 1text on background, AAA
- 15.7 : 1button label, AAA
Shadows
A soft neutral shadow

The Challenge
Investing teaches badly in prose. The difference between "6% interest" and "6% interest for twenty years" is obvious in a chart within a second. It disappears inside a paragraph, and that’s exactly where a reader abandons the course. So the platform couldn’t be a pile of articles with a quiz at the end.
What we did, and why
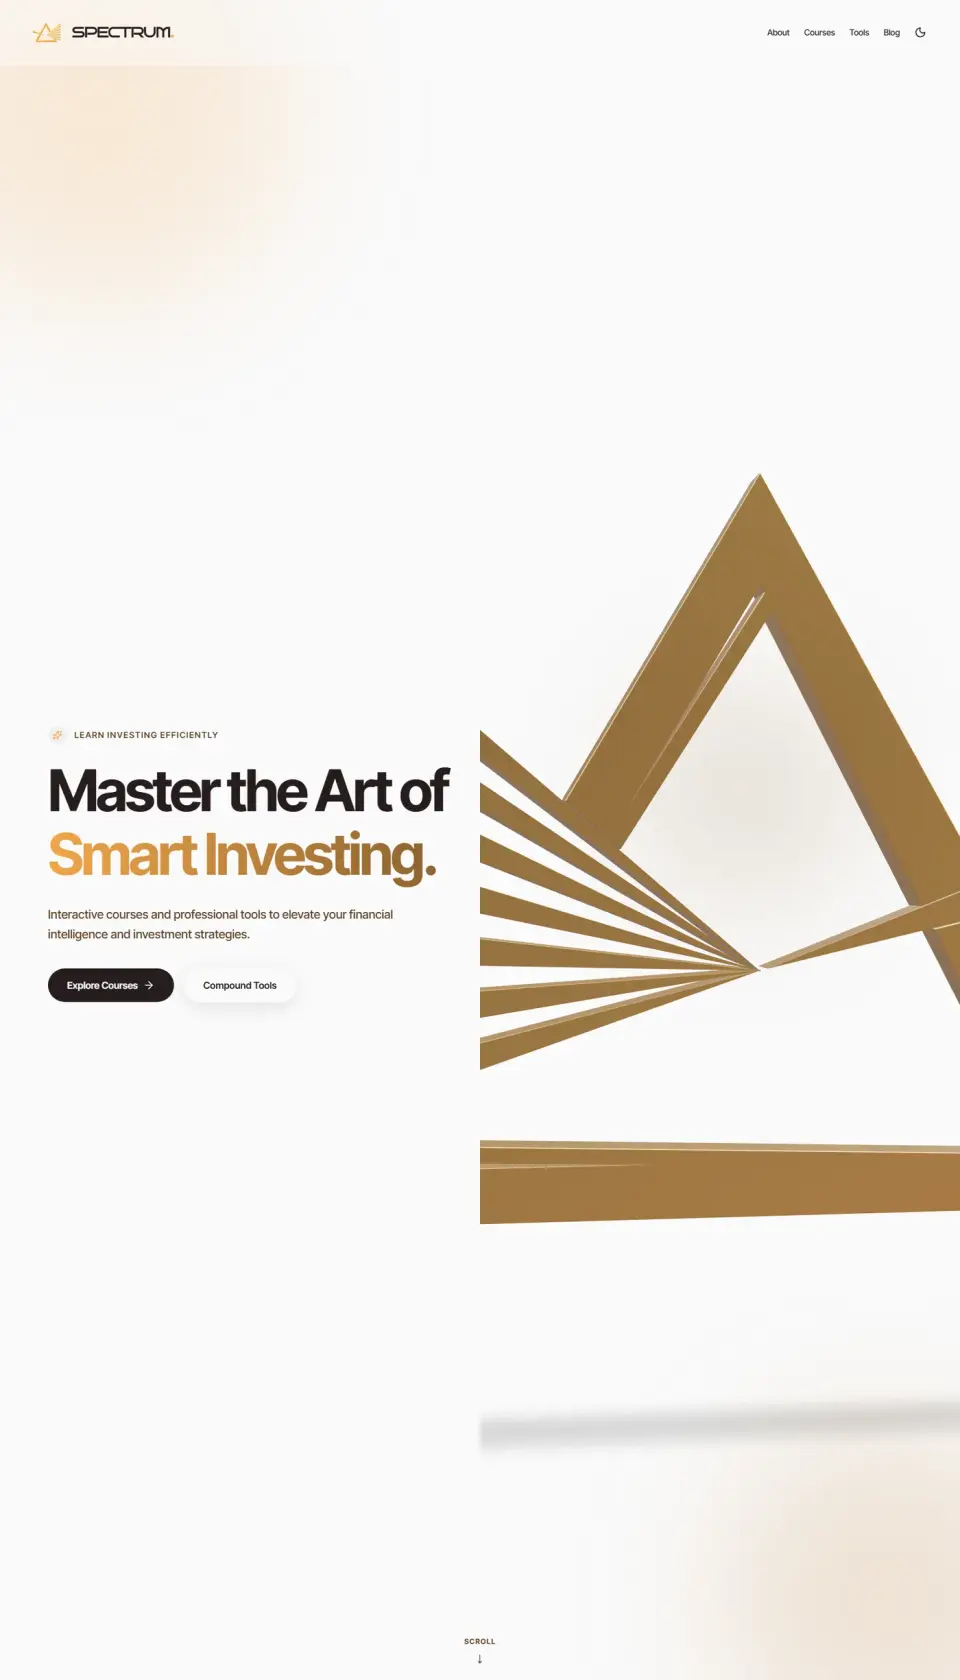
Courses and tools are one application: calculators and models sit inside the lesson itself. The spatial scene runs in the browser through Three.js, with no plugin and no install, and GSAP drives the motion. The interface holds a dark background and a single accent color, so the numbers stay the brightest thing on screen.
A closer look

Where it landed
The project is still in development, and we show it that way on purpose. It's the best evidence of what we can do technically: 3D in the browser, interactive models, a smooth frame. No student or completion numbers will appear here until the platform runs for real.