Geiger Performance Lab
An experiment built around one question: what would badly written code sound like if you could hear it? The answer is a Geiger counter.
Measured on the live site, exactly as a visitor sees it.
Share Tech Mono
Headings and bodyAa
- GeigerRegular 400
ABCDEFGHIJKLM abcdefghijklm 0123456789
Corner radii
- 0 px
- 4 px
Buttons: 0 px
Type scale
- AaReadout, 80 px
- AaH1, 32 px
- AaLead, 24 px
- AaBody, 16 px
Contrast
- 17.5 : 1text on background, AAA
- 13.8 : 1button label, AAA
Shadows
A glow in place of a shadow
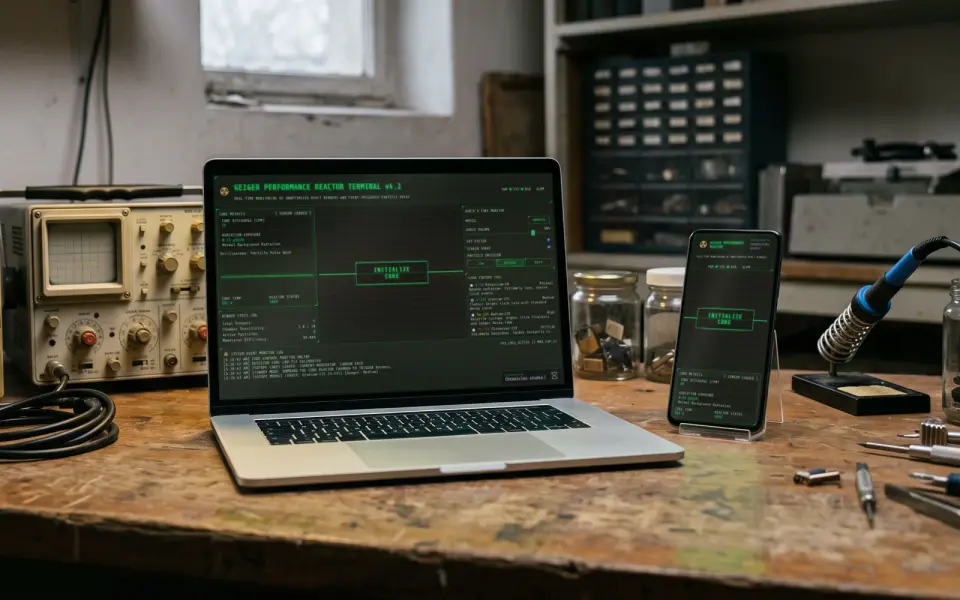
Context
The studio built Geiger Performance Lab for itself in 2026, with no client and no brief. Numbers like render milliseconds mean nothing to most people, so the idea was to translate them into the sound of a Geiger counter. The result is a standalone React app that lives alongside the studio's other cases and links back to chronicles.cz itself.
The Challenge
Web performance gets discussed in numbers nobody outside the trade understands. "An unnecessary component re-render" frightens no one, unlike the clicking of a dosimeter, which everybody recognizes from films and which makes everybody's stomach tighten.
The constraint
A site about code speed has to be fast itself. That means no backend and no extra libraries: all the state lives in the browser on one page. A normal audio player stumbles on frequent repeats and cuts the sound off. So dosimeter clicks run through a pool of pre-created audio elements, and the click file itself is the same one for every isotope.
The decisions, pinned where they live
Why we made it this way.
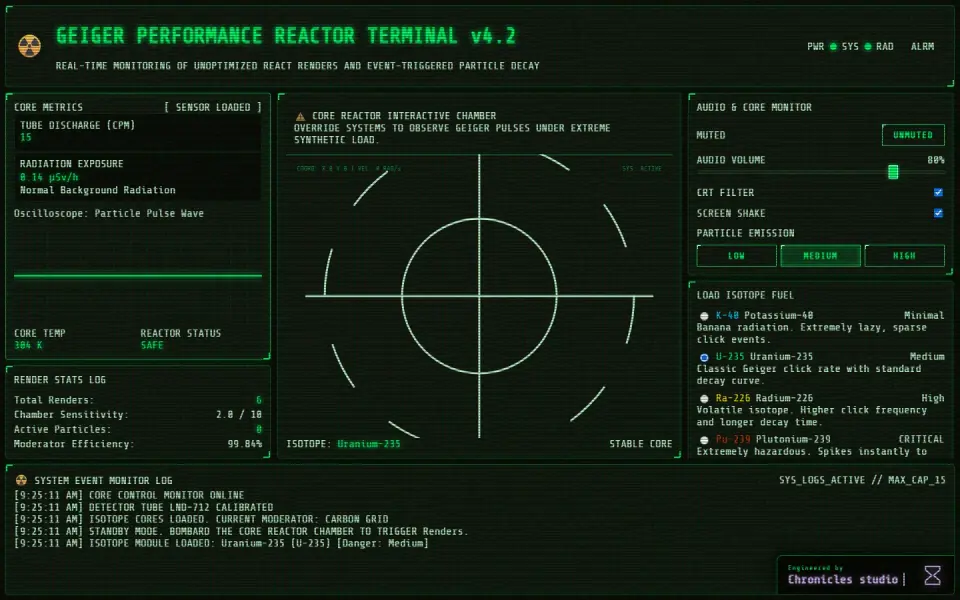
Clicks per minute, dose in μSv/h and core temperature update on the fly and tint the panel from green to red as the load climbs.
Mouse speed inside the black chamber turns into the dosimeter's click rate and into particles on the canvas. Slow movement is barely audible; a fast one drives the counter to its limit.
Potassium-40, uranium-235, radium-226 and plutonium-239 are picked from the ISOTOPE FUEL list. Each has its own click frequency and decay curve, from a banana-level background to an almost instant run to meltdown.
In the bottom right, the app signs itself and links to chronicles.cz right from the interface.
Clicks per minute, dose in μSv/h and core temperature update on the fly and tint the panel from green to red as the load climbs.
Mouse speed inside the black chamber turns into the dosimeter's click rate and into particles on the canvas. Slow movement is barely audible; a fast one drives the counter to its limit.
Potassium-40, uranium-235, radium-226 and plutonium-239 are picked from the ISOTOPE FUEL list. Each has its own click frequency and decay curve, from a banana-level background to an almost instant run to meltdown.
In the bottom right, the app signs itself and links to chronicles.cz right from the interface.
What we did, and why
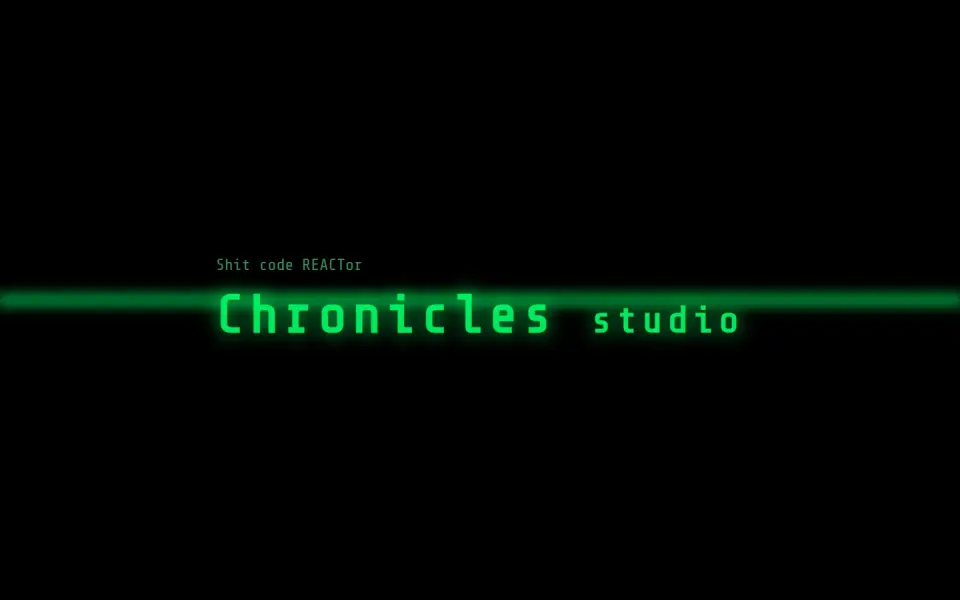
The reactor before startup
Before it starts, a dark screen holds for two seconds with a joke label, "Shit code REACTor," and the studio's logo. Then the reactor shutters open and the dashboard appears on screen.
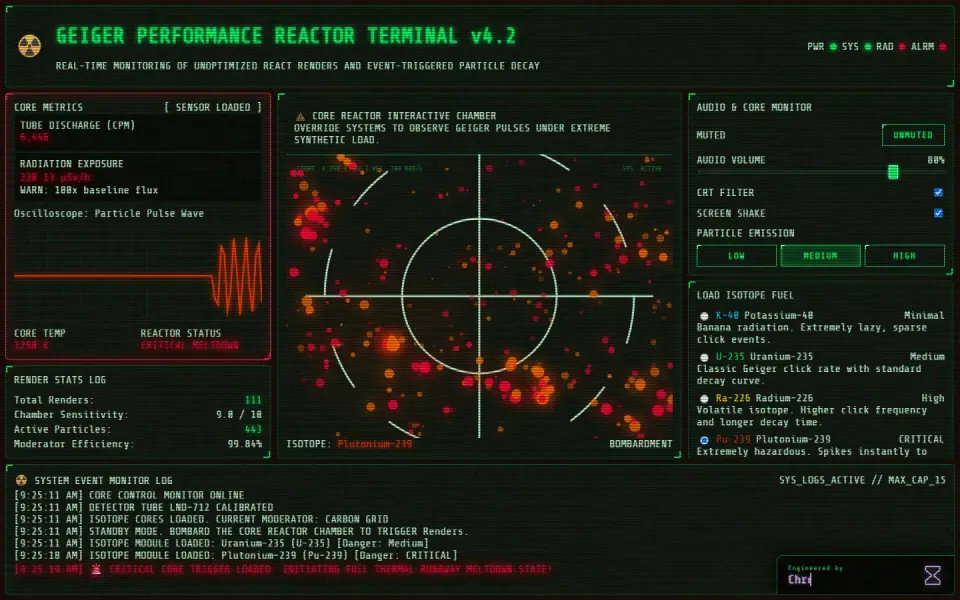
Buttons for a demo meltdown
The "Core Runaway Test" button fires off a hundred and twenty renders in a row with no mouse movement at all. Particles flood the chamber, the oscilloscope breaks into a sawtooth, and the PWR, SYS, RAD and ALRM lights turn red.
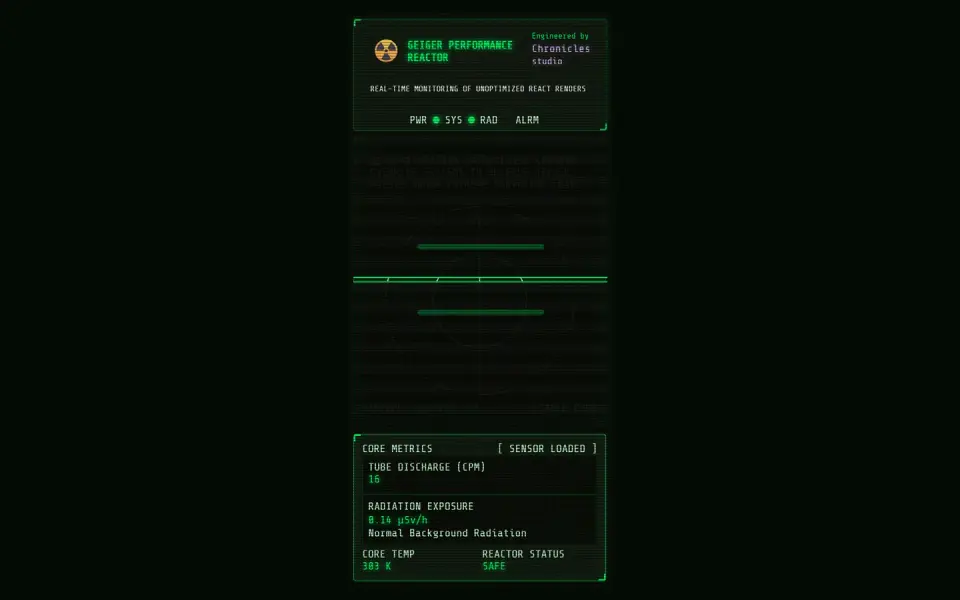
A separate layout for phones
On a phone, the header turns into a card with the logo, the title and the studio's signature. The three columns of panels stack one under another, and none of them get lost.
Where it landed
An internal project we enjoy making that also proves a point: the whole application weighs 78 kB compressed and answers in under a tenth of a second. A site that talks about speed should be fast, even as a joke.
A closer look
Click any frame to open it full screen.